For as long as I can remember I recall the media and fans alike being overwhelmed with the feeling of shock and amazement during the first week of the Tour de France claiming it’s getting more and more dangerous every year. Craig Fry looks into the history and past data to determine if this is actually the case, or if we just have a short memory. -Wade Wallace
It has already been an eventful Tour de France this year. To stage seven there have been 12 rider abandons due mostly to crashes, and many other riders are nursing significant injuries. Some commentators are calling this year’s race the ‘Tour de Carnage’, and others are talking about the ‘curse of the yellow jersey’.
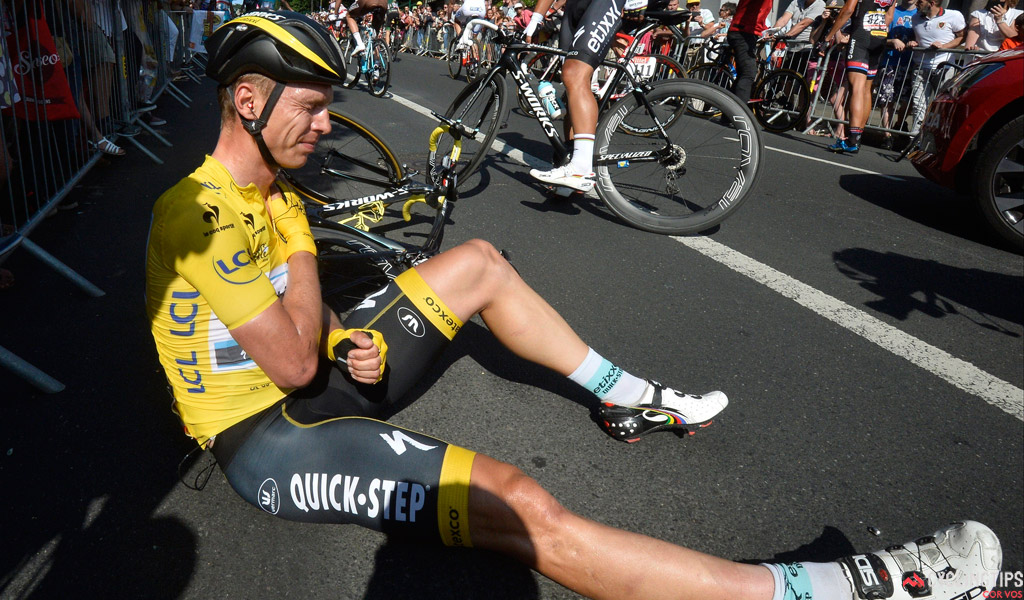
There have been very few yellow jersey abandons due to crashes over the years, but in 2015 we have already seen two Tour leaders exit the race in yellow – Fabian Cancellara after a stage three crash left him with fractured vertebrae, and Tony Martin after a collarbone shattering crash in the final kilometre of stage six.

History shows that the Tour de France is usually hectic in the first week or so. The combination of fast sprint stages, early rider nerves, and teams with GC contenders battling to maintain good positions can certainly make the first week seem dangerous. As the saying goes, you probably won’t win the Tour in the first week of racing, but you can easily lose it there.
Every year as the inevitable crashes and rider abandons happen in the first few Tour stages, the question of whether the race is getting more dangerous usually arises. People typically question the rider numbers in teams, the number of teams given entry, the chosen course for each stage, and the safety protocols.
Is the Tour de France really more dangerous these days? One way to try and answer this is by looking at the number and rates of rider abandons each year.
Number and rates of rider abandons each year
Last year, the person behind the Squadralytics blog analysed the number of Tour de France finishers versus the number of starters from 1999 to 2013, and up to stage 11 in 2014. The analysis showed that recent Tours (2009-2014) have had less attrition than the 15-year average (except for the outlier of 2012 which saw 45 abandons for an attrition of 22.7%) – “the others are all clustered in the 26 to 32 range: 2009 (26, 13.3%), 2010 (29, 14.1%), 2011 (32, 15.7%), and 2013 (29, 14.6%) all have attrition that is less than that 15-year average of 20.3%.”
Similar calculations done in July 2011 by Cyclocosm looked at abandon rates up to and including stage nine for 1997-2011, and also took into account the size of the fields. They also reported a slight trend toward lower attrition rates over the 15 years examined, however the number of abandons increased with larger rider numbers – “the rate of attrition by the 9th stage in a 198-rider field is almost a full standard deviation above the average since 1997, while 180-rider fields fall almost a full standard deviation below it.”
Yet another Blogger Vandalarchitect did his own analysis of 2002-2011 also focusing on the first nine stages, but only for verified crashes (excluding abandons due to other reasons). Unlike the Squadralytics and Cyclosm analyses, his figures appear to show a trend towards increasing abandons due to rider crashes from 2008 to 2011.
Mixed results and uncertain data
Taken together, the results are mixed. The method of analysis clearly has an impact on the findings produced. Including ‘all-cause’ abandons gives the impression that Tour attrition rates have not increased in recent times. But if you just look at abandons due to crashes the trend appears to increase.
What is important in looking at the Tour abandon data is being able to verify the reasons why riders withdraw during a stage, or why they are recorded as ‘DNS’ (i.e. did not start) in a particular stage. Naturally, not all withdrawals from the Tour de France are due to crashes and injuries. Some are due to falling outside of stage time limits. Some riders are ousted due to doping (e.g. 1998 Festina affair, Rasmussen’s sacking in 2007 by his team), and some exit due to general illness (viral, gastrointestinal, bronchial and the like).
This means that a better estimate of ‘Tour danger’ may be obtained by focusing on rider abandons due to crashes and related injuries. To improve accuracy here you also need to include the total number of crashes for each stage, and the number of riders involved in each incident, in order to capture the larger group of Tour riders each year impacted by crashes but who do not abandon – for example, Jens Voigt apparently did an informal rider survey on the final Tour stage in Paris and found 75% of finishers reported crashing during the 2012 race.
Ultimately, the biggest challenge in accurately estimating how dangerous the Tour de France is over time is the fact that publicly available data is either incomplete (as is the case with the official Tour website), or does not specify reason for withdrawal or total numbers implicated in all crash cases. Add to this the question of whether or not any estimate of Tour de France ‘risk and danger’ should include both trauma (i.e. from crashes) and overuse (non-crash) injuries and it gets more complicated.
Published injury data
Another indicator of the risk and danger in le Tour is to look at the available published injury data. You might expect that a high profile event like the Tour de France would have had numerous studies undertaken to examine rider crash and injury rates over the years. However, to my knowledge only five epidemiological studies have ever been published on injuries in professional cycling – all retrospective in nature, and none have focused specifically on the Tour de France.
A review of three of these studies was undertaken by Marc Silberman and published in Current Sports Medicine Reports in 2013. Silberman observed the following:
- In a 4-year study of 51 top-level professionals, 43 cyclists experienced 103 injuries, with 50 (48.5%) traumatic injuries and 53 (51.5%) overuse injuries. Twenty-nine cyclists (67.4%) experienced more than one injury. Twenty-eight fractures occurred, with the clavicle having the most common fracture (11 cases). Only eight cyclists (15.6%) were injury free (De Bernardo, Barrios, Vera, Laíz, & Hadala, 2012).
- In another study in elite professionals, 38% of injuries were traumatic and 62% overuse injuries (Barrios, Sala, Terrados, & Valenti, 1997).
- More than two-thirds of traumatic injuries occur in the upper extremity, and two-thirds of overuse injuries occur in the lower extremity (De Bernardo, Barrios, Vera, Laíz, & Hadala, 2012).
- Cyclists are exposed to high traumatic risk racing in a peloton, at high speeds, on various road and weather conditions. By stage 9 of the 2011 Tour de France, 14 fractures occurred and 16 riders retired from the race, with one in intensive care (Greve & Modabber, 2012).
Two other studies help to shed light on general injury patterns for professional cyclists.
In 2010, Bagherian and Rahnama published findings in the British Journal of Sports Medicine from their study of injuries in professional cyclists. Using retrospective data for 2009–2010 from 93 cyclists, a total of 117 injuries (1.2 injury per cyclist per year) were reported, the most common types of which were abrasions (63%), contusions (23%), and strains (8%). The authors reported most injuries were located in the upper (47%) or lower extremities (47%) – with the knee (18%), wrist and palms (16%), shoulder and clavicle (16%), elbow (14%) and femur (14%) the most common sites.
Collision injuries (92%) were most common, caused by collision with other riders (39%), sudden twist in front of other cyclists (13%), collision with road obstacles (11%) and lost control or falls (9%). The rate of injuries on normal roads (91%) was significantly greater than on uphill and downhill roads.
Most recently, in 2015 Barrios and colleagues published in the International Journal of Sports Medicine a descriptive epidemiological study of sports injury changes over time in world-class road cyclists. This study compared two groups of male elite road cyclists (a ‘historical’ group of 65 professionals surveyed from 1983 to 1995, and a ‘contemporary’ group of 65 active elite racers reporting injuries from 2003 to 2009). The authors found that the still active group is exposed to double the risk of traumatic injuries than riders from the 80s and early 90s (perhaps suggesting things are more dangerous today), however the injuries were less severe.
Beyond these studies, the wider literature has highlighted what some have referred to as an ‘epidemic of traumatic brain injury’ in professional cycling. A 2012 Editorial by Greve and Modabber in the Clinical Journal of Sport Medicine has prompted further action, including concussion guidelines and public discussion on the issue.
Overall, while none of the published empirical studies have focused specifically on cyclist injuries as a measure of ‘risk or danger’ in the Tour de France, the research highlighted here shows general injury patterns for professional cyclists.
Addressing the danger of the Tour de France
Regardless of the lack of clarity available on the question of whether or not the Tour de France is becoming more dangerous, it is certain that the event does carry risk of traumatic and overuse injury for the riders - and you might expect to see similar patterns of injury as those observed in published epidemiological studies on general groups of professional cyclists.
The setting of the Tour can bring its own challenges – the weather conditions (cross wind, rain, poor visibility, slippery roads), the ever-present obstacles on and along the road (road signs and structures, huge crowds in close proximity, stray pets, numerous official vehicles), the rider numbers and the inevitable combination of nerves, fatigue, and the inexperience of some. In a fast moving peloton of some 200 riders shoulder to shoulder, hand to hand, hip to hip - barely centimetres away from each other - there’s a very slim margin for error.
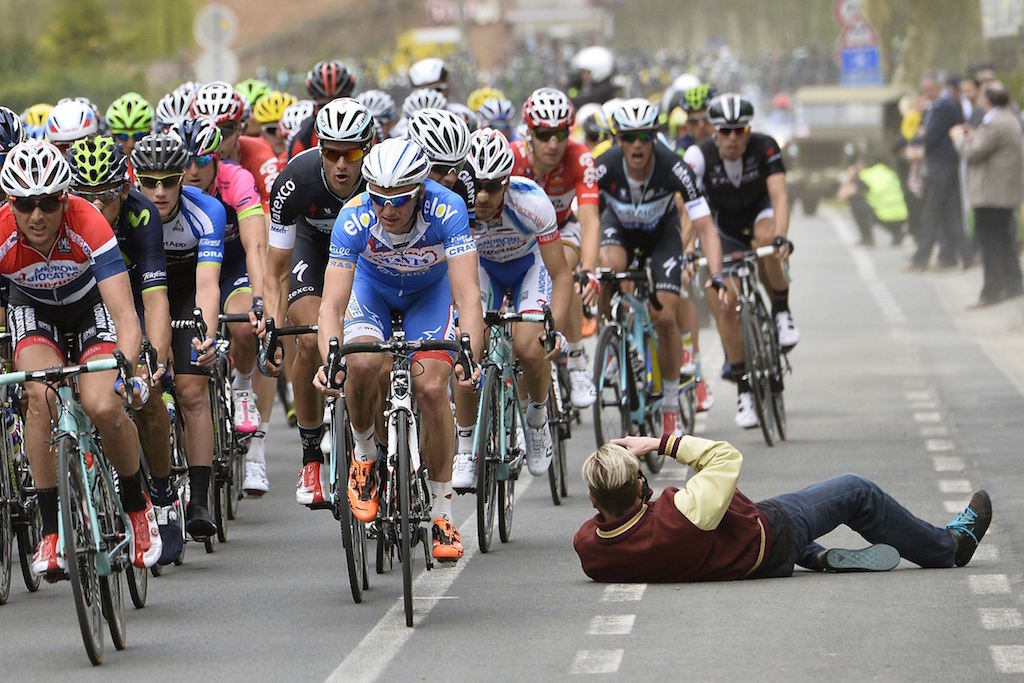
Some have called for fewer teams to reduce the number of riders in the Tour de France peloton, and have questioned the level of experience in some of the wild-card entry teams. Others have argued for more barriers to better separate the riders from the many spectators who stand in the path of the oncoming peloton to cheer, run alongside them, or take ‘selfie’ photographs.

I’m not sure any of these measures would significantly reduce the inherent risks and dangers to the Tour de France peloton. And attempts to overly control and sanitise the most popular cycling race in the world could backfire - for many cycling fans the hardship endured by the riders is part of the Tour’s appeal.
For better or worse, the inherent dangers of the Tour have become part of its legend, and have elevated some riders in the eyes of fans (consider for example the accolades received by Australian Michael Matthews in riding through his current injuries, or the similar public reaction to Johnny Hoogerland after his crash through barbed-wire in the 2011 Tour).
The Tour de France is certainly risky and dangerous for some riders. The high profile rider abandons after crashes do capture public attention, and can create a sense that things may be getting worse.
At present however we don’t have the data required to know if the Tour de France is really becoming more dangerous.
Craig Fry is Associate Professor, Centre for Cultural Diversity and Wellbeing at Victoria University.
This article was originally published on The Conversation.
